
 Version 3.0
Thermal response test interpretation software
A thermal response test runs for days, unattended, on a construction site, and the standard way of reading it assumes the heat injection never wavered. TRT Analysis interprets the test you actually recorded.
Windows 10, Windows 11 and macOS. Nothing runs in the cloud.
What an interrupted test costs
A thermal response test runs for days on a construction site, usually unattended, and the standard interpretation assumes the heat injection never wavered. A generator trips, the grid fails, the injection stops for a few hours, and the record no longer satisfies the assumptions the straight-line methods rest on. What happens next is one of two things: the test is repeated at full cost, or it is interpreted as though nothing had happened, carrying a bias nobody has quantified.
Either cost is real, because a thermal response test is the only in-situ measurement that ties a borehole field to the ground it will be drilled into. The conductivity and the borehole resistance it returns set the required length, the undisturbed temperature it measures sets what that length is sized against, and between them they set a large share of the capital cost of the installation.
This software was written by someone who designed, ran and interpreted dozens of these tests as a consultant, and lost a few of them to an interruption. It pairs two complementary methods so that an interrupted or pulsed record can still be read rather than restarted at full cost — and it is just as ready to say when a test does not support a confident answer.
Calibrating a test in real time
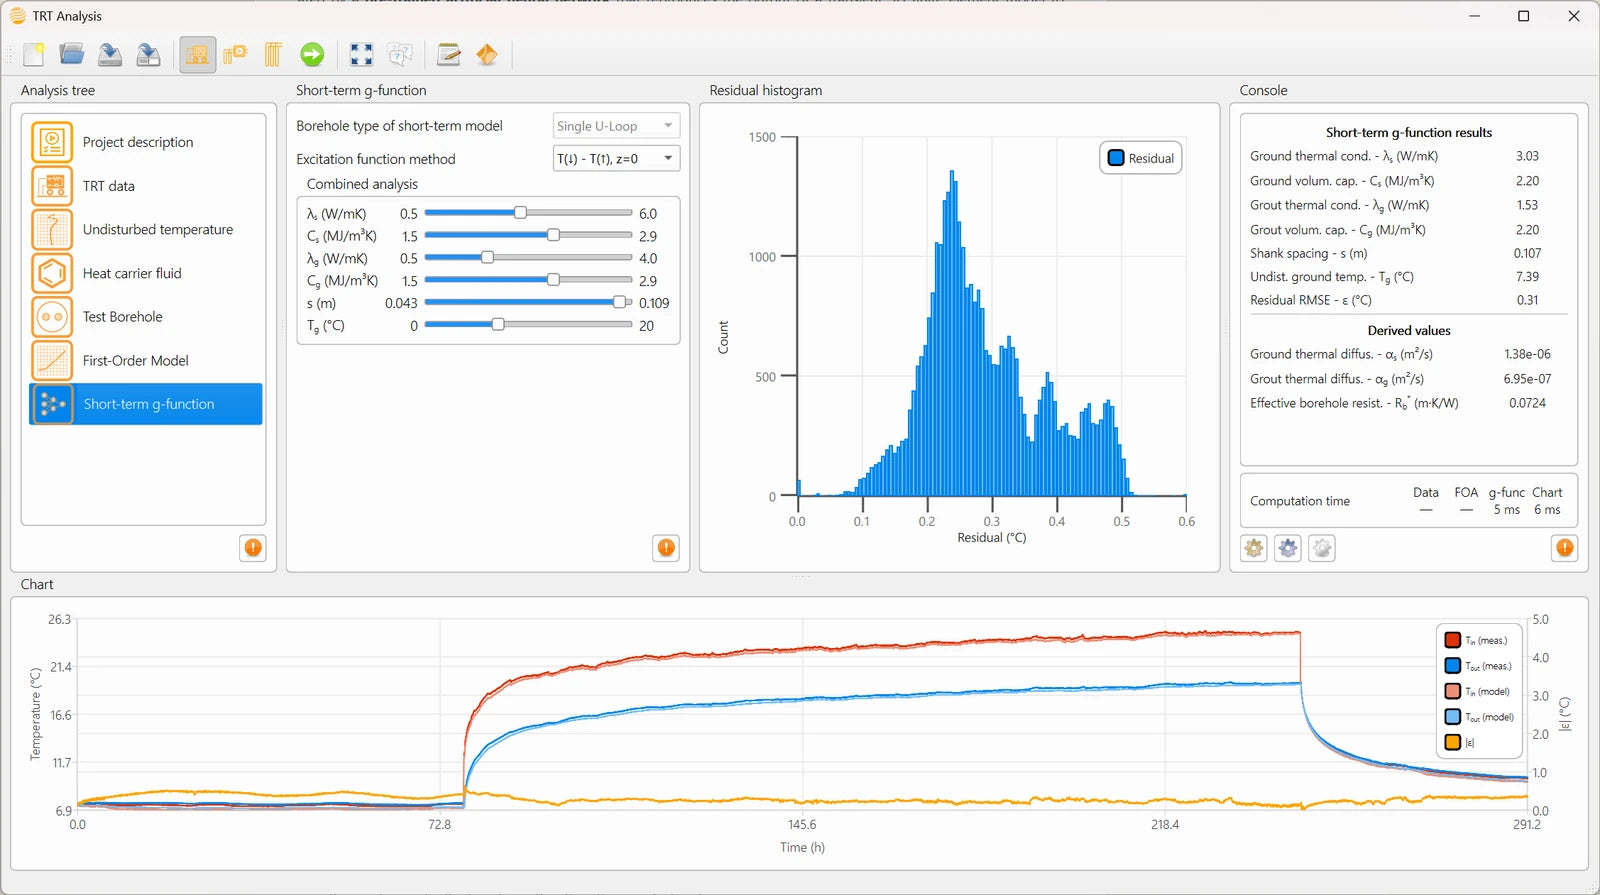
Most TRT software fits the short-term model through an offline optimizer and hands you the answer once it converges. TRT Analysis calibrates live instead: six sliders drive the short-term g-function directly against the measured record, and the residual statistics update with every move, so you watch which parameter the test actually constrains and which one is only riding along.
What it computes

Reading the record
- CSV import of the test series, or paste straight from a spreadsheet, and copy the loaded table back out
- Low-pass filter for measurement noise
- Interactive selection of the circulation, heating and recovery phases

Undisturbed ground temperature
- Three ways to determine it: manual entry, the circulation phase, or a logged vertical temperature profile
- A vertical profile also yields the mean annual ground temperature, read from the depth range the seasonal signal no longer reaches
- Dual-range sliders select the averaging window on the circulation phase and the profile, adjustable a step at a time with the keyboard
- All three methods reported side by side in the console, next to the value the short-term g-function currently carries on its own slider
- Sets the reference both interpretation models are read against, and the boundary condition the field is later sized to

First-order approximation
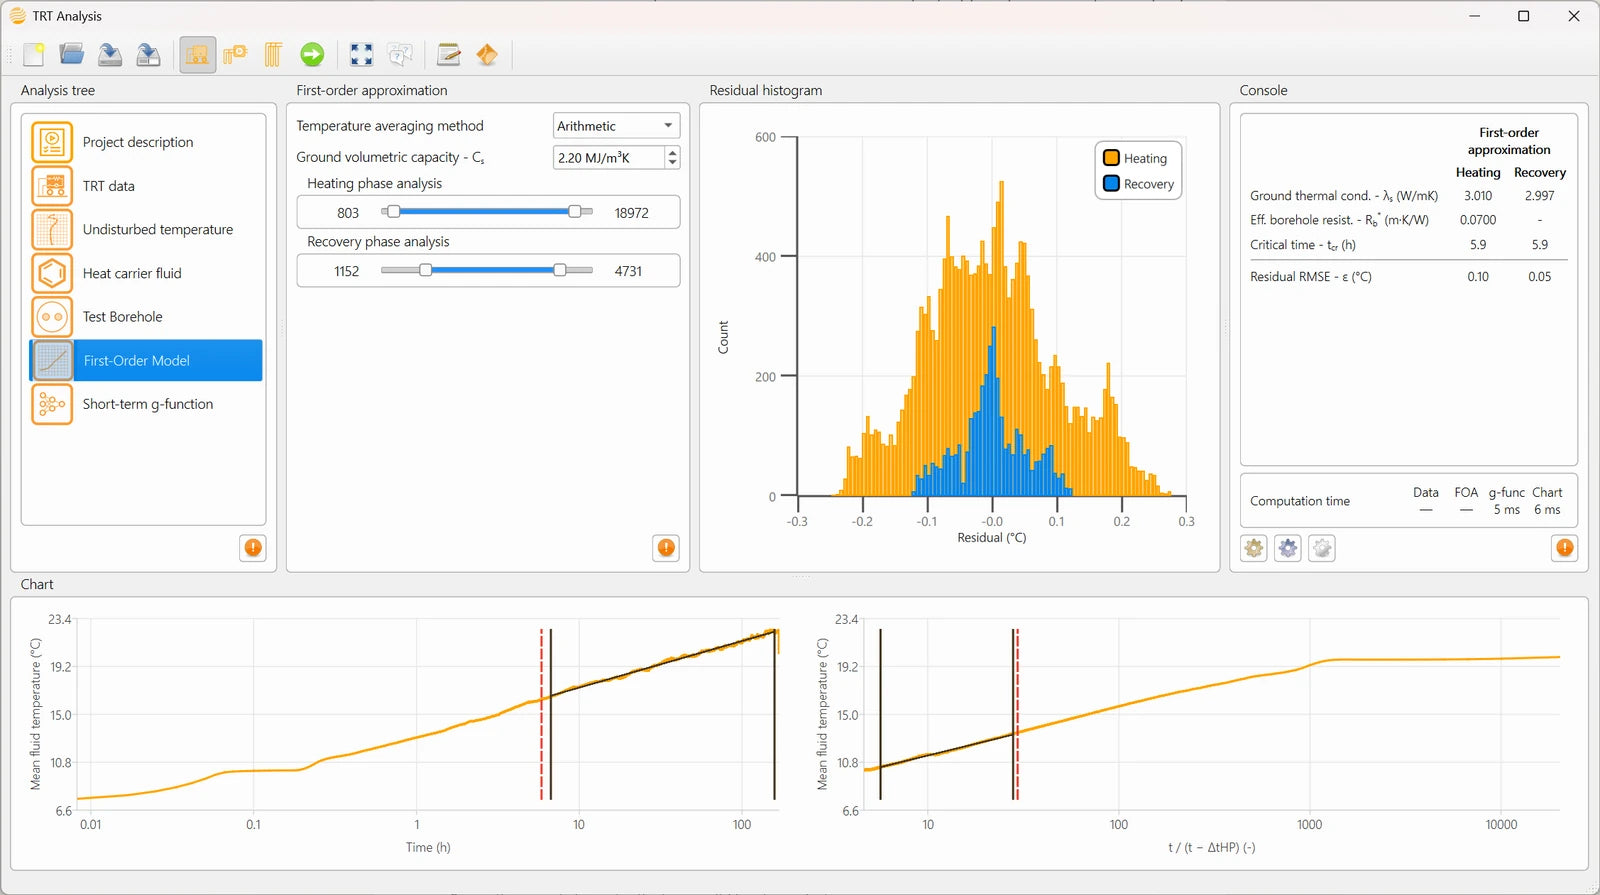
- Infinite line-source regression on the heating phase
- Independent regression on the recovery phase, as a cross-check rather than a second measurement
- Ground conductivity and experimental effective borehole resistance
- Critical time drawn on the chart, so the data that must be excluded is visible rather than assumed
- p-linear average of the mean fluid temperature, alongside the arithmetic mean
- Works on all five test-borehole configurations: single and double U-loop, coaxial, standing column

Short-term g-function
- Borehole response reconstructed by a network pre-trained on 3D transient finite-element results, to within 1 × 10⁻⁴ °C
- Convolved with the heat-injection history as it was measured, so the model follows every ramp, pause and shut-off
- Standard, pulsed and interrupted tests
- Heating and recovery interpreted together, not one after the other
- Six-slider calibration with live residual statistics
- Single U-loop only. The limit is stated because it matters

Diagnostics, new in 3.0
- Reynolds number and flow-regime flag, per phase
- Histograms of heating power, flow rate and model residuals
- Residual mean, standard deviation and RMSE
- Values read off any curve or histogram bar on hover
- Scaled cross-section of the test borehole
What makes it different
Two methods, and an honest division of labour.
The first-order approximation is the reading practitioners know and standards recognise: fit a line to the late-time temperature against the logarithm of time, take the conductivity from the slope and the borehole resistance from the intercept. It asks for a constant injected power over the window being fitted, and it applies to any borehole configuration, because the line is fitted to the mean fluid temperature and to the power per metre, neither of which cares how many pipes the hole carries.
The short-term g-function asks the opposite trade. It reconstructs the borehole's own response from the first minutes rather than only at late times, then convolves it with the power that was actually measured. Because the real signal drives the convolution, the model follows the test through its ramps and its stoppages, which is precisely why it reads the early hours, the recovery, and the pulsed or interrupted records the line-source model cannot. Its price is configuration: the network was trained on single U-loop boreholes.
Each method covers the other's blind spot. Where a test carries both a recovery and a steady injection, running both and comparing is the strongest reading available: they use different data through different regressions, so agreement is reassuring and a discrepancy is a warning, usually about an unstable injection, a test cut short, or groundwater.
A surrogate, not a statistical model
The network is a fast, deterministic stand-in for a detailed physical computation, not a model fitted to your data. For the same inputs it returns the same response, every time. It replaces a finite-element run that would take too long to sit behind a slider, and nothing else.
Two routes to the same signal, and what their disagreement tells you
The excitation driving the convolution can be built from the two measured temperatures, or from an energy balance on the measured power and flow rate. They are two routes to one physical quantity, so a marked disagreement between the fits they produce is itself a measurement: it says the power, the flow rate and the temperature difference are not mutually consistent, which usually means a mis-scaled flow meter or a fluid other than the one declared.
One project file, three modules
The interpretation does not end in a report to be retyped. The conductivity, the resistance and the undisturbed temperature you identify here are already in the project file the sizing module opens, and the same file carries on to the network module. One record, from the test on site to the pipe that connects the field.
Published methods
The models in TRT Analysis are published, peer-reviewed and citable. TRT Analysis is developed by a spin-off of Polytechnique Montréal, and a share of its revenue goes to the graduate students whose research it implements.
- Marcotte, D., Pasquier, P., 2008. On the estimation of thermal resistance in borehole thermal conductivity test. Renewable Energy 33(11), 2407–2415.
- Pasquier, P., Marcotte, D., Bernier, M., Kummert, M., 2013. Simulation of ground-coupled heat pump systems using a spectral approach. Proceedings of the 13th IBPSA Conference, 2691–2698.
- Dusseault, B., Pasquier, P., Marcotte, D., 2018. A block matrix formulation for efficient g-function construction. Renewable Energy 121, 249–260.
- Pasquier, P., 2018. Interpretation of the first hours of a thermal response test using the time derivative of the temperature. Applied Energy 213, 56–75.
- Pasquier, P., Lamarche, L., 2022. Analytic expressions for the moving infinite line source model. Geothermics 103, 102413.
- [À compléter depuis help/trt/help_20_references.md : Pasquier, P., Marcotte, D., 2020 — le cadre d'inférence que suit le réseau.]
One application, one download
 TRT Analysis
 GHE Analysis
 GLN Analysis
TRT Analysis is one module of Analysis Suite. TRT Analysis interprets the thermal response test, GHE Analysis designs the ground loop, and GLN Analysis balances the network that connects it. They share the heat-carrier fluid, the project record and the console.
The conductivity and the borehole resistance fitted here can be carried into GHE Analysis, and you choose which technique's value travels. A ground property measured on site does not have to be retyped to size a field with it.
Pricing
TRT Analysis is included from the Intermediate tier up. The Small tier is built for residential loops, where a thermal response test is not part of the work.
Free for academic research and classroom use — see the academic licence.
Questions
What does TRT Analysis interpret?▾
TRT Analysis reads a thermal response test record and returns the ground conductivity, the borehole resistance and the undisturbed ground temperature — including tests interrupted by a power outage or a stopped pump, which the standard line-source method cannot use.
Does it handle a test interrupted by a power outage or equipment failure?▾
Yes. The short-term g-function model is convolved with the heat-injection history exactly as it was measured, so it follows every ramp, pause and shut-off in the record instead of assuming a constant injection throughout.
Does the software cross-check its own results?▾
Yes, when the test allows it. The first-order approximation and the short-term g-function use different data through different regressions, so running both on the same test and comparing is a built-in consistency check, not an extra step.
Can I see which parameters the test actually constrains?▾
Yes. Six sliders calibrate the short-term g-function directly against your measured record, and the residual statistics update with every move — so you see in real time which parameter the data actually pins down and which one is only guessed.
Is TRT Analysis hard to learn?▾
No. The interface is built for a fast, guided first session, not a course of video tutorials before you can start an interpretation. Context-sensitive help is one click away on every panel, and the full manual is available online or as a PDF whenever you need more depth.